

How data-led design increases vacation rental revenue
Two rentals, same street, same beds, same manager. But one out-earned the other by 79%, and design was the only difference. Our CEO led a panel at VRMA 2026 where they dissected the numbers that prove design moves nightly rate, reviewed three projects that paid back in under a year, and highlighted how to hand owners a plan they’ll actually approve.
From April through November last year, one brought in $22,914. The other brought in $41,105. That is 79% more revenue, at a higher nightly rate ($243 versus $218) and, oddly, lower occupancy. The only thing that changed between them was design.
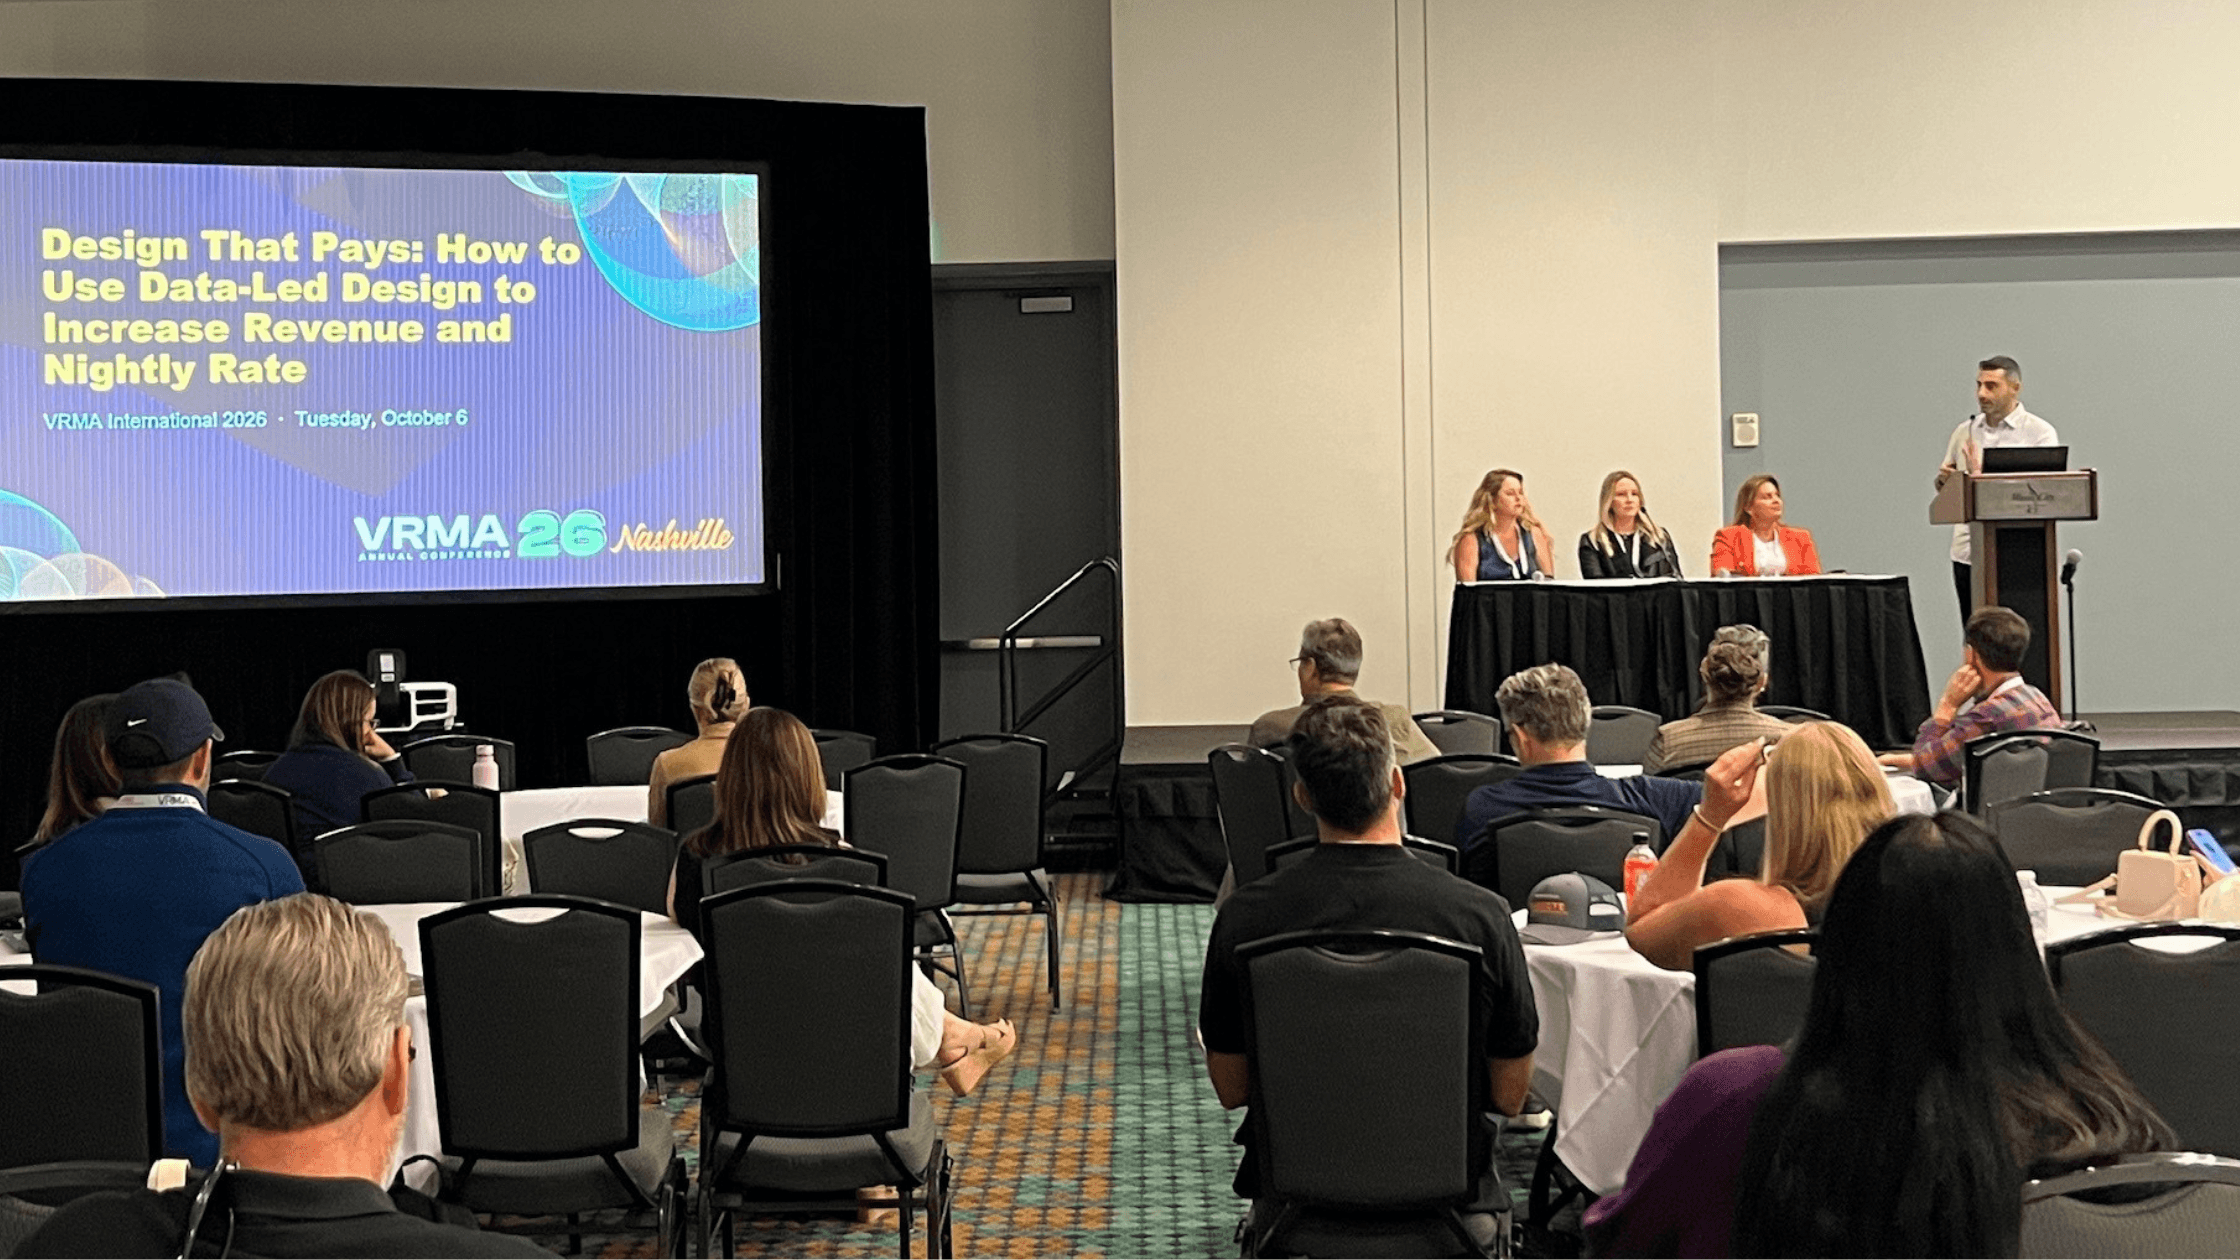
That comparison set the foundation for VRMA’s 2026 panel conversation, "Design that pays: How to use data-led design to increase revenue and nightly rate." HostGPO’s CEO, Jeff Iloulian, put the hard questions to three operators who treat design as a revenue line instead of a decorating budget: Nichole DiPippo of Cozy Quarters, Jessica Duce of JDuce Design, and Heather Martini of Data Led Designs. Their case, backed by market data and real payback numbers, comes down to one idea. Design is one of the few levers that moves nightly rate, and the data tells you exactly where to pull it.
Design is a revenue decision, not a vibe
The first question on the panel was the blunt one: is this just bling-my-crib for the luxury few? The answer is a resounding, no. This applies to everyday one-to-three-bedroom homes in both urban and vacation markets, not only to trophy properties.
The market is already rewarding it. Luxury Airbnb listings (nightly rates above $500) grew revenue 28% year over year in 2025, nearly twice the pace of standard rentals, according to AirDNA. And the gap is not only about price. In Heather Martini's experience, properties that work with a top designer land in the top 5% of their market.
The mistake is treating design as taste. A redesign is capital you deploy against a target nightly rate and occupancy, with a payback period you can calculate before you spend a dollar. Framed that way, the question stops being "do I like it" and becomes "what will this room earn." Every number in this piece follows from that shift.
Pull the report before the paint chip
The expensive mistake is not accidentally overspending on a redesign. It is skipping the research that tells you which redesign actually pays. The panel kept returning to the same move: pull the market report first.
That report answers three things. Which amenities do the top 20% of listings in your submarket actually have, and where the comp set is thin enough to stand out. What the market rewards right now, meaning where demand is moving and which features drive bookings. And who is really booking, because a home built for multigenerational groups (toddlers to grandparents, accessibility included) gets designed differently than one chasing couples.
Skip that step and you pay for it three ways. Wrong room: the budget lands where guests do not make the booking decision. Wrong amenity: you add something that is popular in another market, not yours. Wrong market: you run a Scottsdale playbook in a non-coastal two-bedroom. The point is, you do not want to write big checks written against a big guess. You want direction, data, and a methodical approach to delivering properties that generate revenue.
The proof: Designed homes earn more in the same market
Heather Martini's team ran bedroom-matched comparisons across three very different markets. Same market, same bedroom count, the main variable being design and the strategic amenities that come with it. The nightly rate and annual revenue gaps are substantial.
Then it compounds. A property manager running a strategically designed portfolio out-earns one running mixed-quality homes in the same market, at the same property count. In Phoenix/Scottsdale, that was 390% more portfolio revenue ($3.97M versus $803K across eight homes each). In Asheville, 290% more. In the Poconos, 67% more. One well-designed home is a win, and a full portfolio of them becomes a different business.
Refresh or redesign? Let the data pick the scope
A refresh is styling and fast amenity wins. A full design rebuilds the space.
The per-dollar math is less intuitive than it looks. A $28,990 refresh on a 4,351 square foot five-bedroom works out to $6.66 per square foot. A $23,453 full design on a 1,033 square foot two-bedroom runs $22.70 per square foot, more than three times the rate, and it still paid back inside a year.
The talk covered three real projects, all recovering their cost in well under a year:
Old Lake Trail earned $57,000 since its October 2025 launch, nearly double the refresh cost, and the gap over comps is still widening. James St cleared $62,018 in its first twelve months. None of these are coastal trophy homes. They are ordinary properties where the scope matched the data.
The three-phase plan that gets owners to yes
Stop pitching projects. Hand owners a sequenced plan with a payback number attached to each stage. The panel framed it in three phases:
- Quick wins. Styling and fast amenity upgrades. Low budget, fastest payback.
- Core investment. The upgrades that actually move nightly rate. Mid budget, payback in months.
- Differentiator. The amenity stack that puts you at the top of the market and keeps you there.
That top-end stack is built around a simple goal: a stay guests never need to leave. Indoor, that is a theater, a sauna, a game room. Outdoor, a pool, a hot tub, an outdoor kitchen. The mix is tuned to the market, indoor-heavy where it is cold, outdoor-led where it is warm, and benchmarked against the top performers in that market, not the national average.
Sequencing it this way does two things. It lets an owner start small and see the return before committing to higher phases of investment. And it changes your role from vendor pitching a line item to the growth partner owners do not leave.
The four objections, answered with numbers
The panel closed with a devil's advocate round. Key to this, is that every objection gets answered with a number, not a philosophy.
Q: "Why spend $20K when it's already booking?"
A: Booking is not the same as fully booked at the right rate. Old Lake Trail was booking before its refresh too. The refresh still lifted revenue 22% and RevPAR 46% over comps, and paid itself back in seven months. "Already booking" usually means you cannot see what you are leaving on the table.
Q: "My owner will never approve this."
A: Owners do not approve projects. They approve returns. Walk in with a seven-month payback and a phased plan, and the conversation changes.
Q: "Can't I just do this myself?"
A: You can style a room yourself. The part that pays is the data step and the buying power behind it, which is where do-it-yourself quietly leaks money on the wrong room or the wrong amenity. Working with a top designer is what puts a property in the top 5% of its market.
Q: "This only works in Scottsdale or the Smokies."
A: A two-bedroom in Cary and a home in the Poconos both paid back inside a year. The playbook travels. The amenities just change.
Where the buying power changes with math
There is one more lever that sits underneath all of this. Procurement leverage lets the same budget buy more. The dollar figure stays flat, the spec goes up, and the payback period gets shorter. Collective buying power is exactly what HostGPO's vendor partner network exists to give you, which means the refresh and full-design numbers above are a floor, not a ceiling.
The framework in a sentence: treat design as a revenue driver, backed by data instead of guesswork. Know your competitive landscape, pull the report before the paint chip, benchmark against your market's top earners rather than a national listicle, and walk into the owner conversation with a number for every "yeah, but."
Thanks to the panelists who made the case: Jeff Iloulian of HostGPO, Nichole DiPippo of Cozy Quarters, Jessica Duce of JDuce Design, and Heather Martini of Data Led Designs. If you want help running the numbers on your own properties, or stretching a design budget with group pricing, that exactly is the kind of thing we are here for!


